
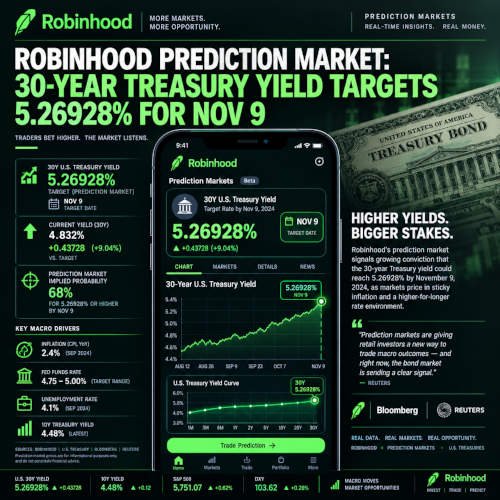
The U.S. Treasury market is attracting attention as investors monitor borrowing costs, Federal Reserve policy expectations and movements in long-term government bond yields. On November 9, 2026, a short-term financial prediction market on Robinhood focused on one specific question: Would the 30-year U.S. Treasury yield finish a 15-minute trading window at or above 5.26928%?
The Robinhood contract covered the period from 5:15 a.m. to 5:30 a.m. Eastern Standard Time. Its outcome depended on a designated market-data source rather than the daily Treasury yield published later by the U.S. government. This distinction is important because a 15-minute prediction market measures a specific moment, not the entire day’s bond-market performance.
The event also comes as investors assess the impact of stronger U.S. employment data, changing expectations for Federal Reserve interest rates and movements in oil prices. These factors can influence Treasury bond prices and yields, making long-term government debt an important part of the financial news cycle.
What Happened in the Robinhood 30-Year Treasury Yield Market?
Robinhood listed a financial event contract titled “30-year U.S. Treasury yield 15 min · 5:15–5:30 AM EST” for November 9, 2026.
The central threshold was 5.26928%. The contract asked whether the 30-year U.S. Treasury yield would be at or above that level when the specified 15-minute period ended.
According to the contract information, the market used the closing yield of a one-minute Pyth candlestick ending at 5:30 a.m. EST. The underlying instrument was identified as US30Y, representing the current on-the-run benchmark 30-year U.S. Treasury bond.
The market page showed the “5.26928% or above” contract at approximately one cent when the page was captured. That price represented market pricing at the time, not an independently verified final result. Prediction-market prices can change as participants buy and sell contracts.
Investors should therefore avoid interpreting the displayed price as proof of the final Treasury yield or the confirmed settlement outcome. The contract’s official resolution depends on its stated data source and rules.
Why the 5.26928% Treasury Yield Level Matters
The 30-year Treasury yield is an important indicator of the long-term cost of borrowing in the United States. It represents the annualized return investors demand for holding long-dated U.S. government debt.
A higher 30-year Treasury yield generally means investors require greater compensation to lend money over a longer period. A lower yield can indicate stronger demand for government bonds, expectations of lower future interest rates, or changing views about economic growth and inflation.
The 5.26928% target was particularly relevant because recent official data placed the 30-year Treasury yield close to that level.
The U.S. Treasury’s daily yield-curve data showed a 30-year yield of 5.26% on November 6. The figure was 5.25% on November 5 and 5.28% on November 4. This recent movement illustrates how a small change in market conditions can move long-term yields around a narrowly defined prediction-market threshold.
However, the official daily Treasury yield and the Pyth market-data reading are not interchangeable. The daily Treasury figure is calculated and published under the government’s yield-curve methodology, while the Robinhood event used a specified one-minute market-data observation.
Strong U.S. Jobs Data Put Treasury Yields in Focus
The November 9 contract followed a week of important economic developments. U.S. employment data released on November 6 showed that nonfarm payrolls increased by 165,000 in October. That was significantly higher than the 65,000 increase economists surveyed by Reuters had expected.
The unemployment rate also declined to 4.1% from 4.2% in September.
The stronger employment report influenced expectations about the Federal Reserve’s next policy decision. Investors considered whether a resilient labor market could give policymakers more reason to maintain restrictive monetary conditions or increase interest rates to control inflation.
Reuters reported that the 30-year Treasury yield rose to approximately 5.277% following the employment data, while the 10-year yield also moved higher. The report highlighted how stronger economic figures can put pressure on bond prices and push yields upward.
This background helps explain why traders were watching the 30-year Treasury yield closely on November 9. Nevertheless, employment figures alone cannot determine the outcome of a short-term yield contract.
Oil Prices and Federal Reserve Expectations Influence Bond Trading
Oil prices were another factor affecting the bond market on November 9.
A Dow Jones market report published early Monday said U.S. Treasury yields edged lower as declining oil prices influenced market sentiment. Brent crude for the January contract was reported down 1.7% at $96.61 a barrel.
The same report said the two-year Treasury yield eased to 4.519%, while the 10-year yield declined to 4.854%, according to Tradeweb data.
Investors were also watching expectations for a possible Federal Reserve rate increase in December. The report cited LSEG figures showing that money markets were pricing in a 78% probability of a rate hike at that meeting. These were market expectations, not an announced Federal Reserve decision.
Oil prices matter because sustained increases in energy costs can contribute to inflation. If investors believe inflation will remain elevated, they may demand higher yields on long-term bonds to compensate for the potential loss of purchasing power.
On the other hand, falling oil prices can ease some inflation concerns and support demand for government bonds. This relationship is not automatic, but it remains an important consideration for fixed-income investors.
How the Robinhood 15-Minute Prediction Market Works
Robinhood’s event contract was designed around a simple Yes-or-No question. Participants could take a position based on whether the 30-year Treasury yield would meet or exceed the stated 5.26928% threshold at the end of the observation period.
The contract rules specified that the result would be determined using the closing yield of the one-minute Pyth candlestick ending at 5:30 a.m. EST on November 9.
The settlement value would be rounded to five decimal places. The rules also stated that later revisions to the underlying data would not be used to change the expiration value.
This method differs from simply checking a financial news headline or looking at the official daily Treasury yield after the market closes. A brief movement around the observation time could determine the result even if the yield moved in the opposite direction later in the day.
Robinhood’s event-contract information also explained that a correct contract generally pays $1, while an incorrect contract pays nothing. Fees and other eligibility restrictions apply. Participants should review the full terms before trading.
Why Prediction-Market Prices Are Not Guaranteed Forecasts
Prediction-market prices can provide an indication of how participants are positioning themselves around a particular event. However, they should not be treated as guaranteed forecasts or official economic data.
A contract priced at one cent may suggest that traders are assigning a low probability to the specified outcome at that moment. It does not prove that the outcome is impossible.
Prices can also change quickly because of trading activity, liquidity, new information and changing expectations. A short-term financial contract may be particularly sensitive to small movements in the underlying market.
For this reason, readers should distinguish between three separate things: the actual Treasury yield, the price of a prediction-market contract and the final settlement decision.
What the 30-Year Treasury Yield Means for Borrowers and Investors
The 30-year Treasury yield matters beyond the government bond market. It can influence the pricing of other long-term financial products, including mortgage-backed securities, corporate borrowing and certain investment instruments.
Mortgage rates do not move in exact lockstep with the 30-year Treasury yield. They are more closely connected to mortgage-backed securities and also reflect lender costs, credit conditions and market risk. However, long-term Treasury yields remain an important benchmark for understanding broader borrowing-cost trends.
For investors, Treasury bonds are often considered a major part of a diversified fixed-income portfolio. Their prices and yields can respond to inflation expectations, Federal Reserve policy, government borrowing needs and demand from domestic and international buyers.
When yields rise, existing bonds with lower coupon rates generally lose market value. When yields fall, those existing bonds may become more valuable. The scale of the price movement depends partly on a bond’s duration and maturity.
This is one reason financial institutions, retirement investors and portfolio managers monitor the 10-year and 30-year Treasury yields so closely.
What Investors Should Watch After November 9
The November 9 prediction-market event was limited to a specific 15-minute period. Broader Treasury-market direction will depend on economic information and investor expectations beyond that short window.
The next important developments include U.S. inflation data, employment trends, Federal Reserve communications and changes in energy prices.
Investors will also watch Treasury borrowing and bond-auction activity. Strong demand at government debt auctions can support bond prices, while weaker demand may put upward pressure on yields.
The October consumer price index report was among the key releases scheduled for the week, according to Monday’s market coverage. Inflation data can influence expectations for the Federal Reserve’s policy path and affect Treasury yields across different maturities.
The Difference Between a Short-Term Market Outcome and a Daily Treasury Rate
A 15-minute prediction contract should not be confused with a daily forecast for the 30-year Treasury yield.
The Robinhood event used a single one-minute Pyth observation ending at 5:30 a.m. EST. The official U.S. Treasury daily yield curve, by comparison, provides benchmark rates for the trading day using its published methodology.
Consequently, the result of the short-term contract cannot establish whether long-term borrowing costs increased or decreased throughout November 9.
Investors looking for a broader picture should compare official Treasury data across multiple trading sessions and examine the 10-year and 30-year yields alongside inflation and economic indicators.
Conclusion: Treasury Yield Prediction Market Highlights Rate Uncertainty
Robinhood’s November 9, 2026, 30-year Treasury yield event placed a 5.26928% threshold at the center of a short-term financial prediction market. The contract measured whether the benchmark yield reached or exceeded that level at the end of the 5:15–5:30 a.m. EST window.
Recent official data showed the 30-year Treasury yield at 5.26% on November 6, while stronger employment figures and changing expectations for Federal Reserve policy kept bond-market volatility in focus.
The event demonstrates how prediction markets are being used to track narrowly defined financial outcomes. However, market prices are not guaranteed forecasts, and the contract’s final result must be distinguished from the broader direction of Treasury yields.
For borrowers, investors and financial professionals, the larger issue remains the outlook for inflation, interest rates and long-term government borrowing costs.
Frequently Asked Questions
1. What was the Robinhood 30-year Treasury yield target on November 9, 2026?
The target was 5.26928% or above for the 15-minute event running from 5:15 a.m. to 5:30 a.m. EST.
2. How did the Robinhood contract determine the result?
It used the closing yield of the one-minute Pyth candlestick ending at 5:30 a.m. EST on November 9, according to the contract rules.
3. What was the latest official 30-year Treasury yield before November 9?
The U.S. Treasury’s daily yield-curve data showed a 30-year yield of 5.26% on November 6, 2026.
4. Why do 30-year Treasury yields matter?
They help indicate long-term government borrowing costs and influence broader financial conditions, including some mortgage and corporate borrowing rates.
5. Does a higher Treasury yield mean bond prices fall?
Generally, yes. Bond prices and yields move in opposite directions, although the size of the price change depends on factors such as maturity and duration.
6. Does a Robinhood prediction-market price guarantee the outcome?
No. Contract prices reflect trading activity and changing market expectations. The final result depends on the official contract settlement rules.
Reference Sources:
- U.S. Department of the Treasury – Daily Treasury Rates: https://home.treasury.gov/resource-center/data-chart-center/interest-rates/TextView
- Federal Reserve – Selected Interest Rates: https://www.federalreserve.gov/releases/H15/
- Robinhood – November 9 Treasury Yield Event Contract: https://robinhood.com/us/en/prediction-markets/financial/events/30-year-us-treasury-yield-15-min-526928-target-nov-09-2026/