
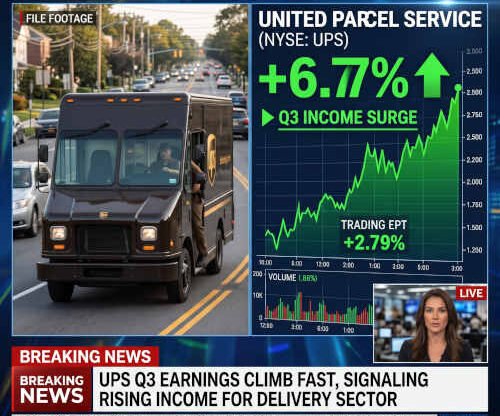

United Parcel Service (NYSE: UPS) reported 3rd Quarter 2026 financial results that exceeded Wall Street expectations, delivering an encouraging barometer for the health of the United States economy this year, October- November 2026. ON this article, read also about the UNITED PARCEL SERVICE Q earnings date, outlook of the latest revenue and profit details, investor relations, etc.
As you may have also known, historically viewed as a premier macroeconomic bellwether, the world’s largest parcel carrier moves approximately 6% of U.S. gross domestic product (GDP) and roughly 2% of global GDP inside its delivery fleet each year.
With consumer sentiment facing sustained pressure from sticky inflation, shifting interest-rate paths, and elevated operating expenses, the logistics titan posted top- and bottom-line beats alongside an upgraded full-year outlook.
What actually stands out in the Q3 financial report is the consolidated revenue, GAAP diluted EPS, non-GAAP adjusted diluted EPS, and consolidated operating profits as well
Key Financial Highlights of 3rd Quarter Performance
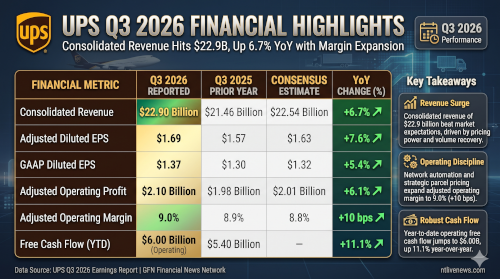
What’s the latest news from UPS? It just posted consolidated revenue of $22.9 billion, marking a 6.7% year-over-year increase and beating analyst consensus expectations. Operating discipline, strategic adjustments in parcel pricing, and network automation drove measurable operational leverage across segments.
| Financial Metric | Q3 2026 Reported | Q3 2025 Prior Year | Consensus Estimate | YoY Change (%) |
| Consolidated Revenue | $22.90 Billion | $21.46 Billion | $22.54 Billion | +6.7% |
| Adjusted Diluted EPS | $1.69 | $1.57 | $1.63 | +7.6% |
| GAAP Diluted EPS | $1.37 | $1.30 | $1.32 | +5.4% |
| Adjusted Operating Profit | $2.10 Billion | $1.98 Billion | $2.01 Billion | +6.1% |
| Adjusted Operating Margin | 9.0% | 8.9% | 8.8% | +10 bps |
| Free Cash Flow (YTD) | $6.00 Billion (Operating) | $5.40 Billion | — | +11.1% |
As you see in the reports shown, spurred by volume resilience and margin recovery, UPS management raised its full-year 2026 consolidated revenue guidance to approximately $92.6 billion, up from prior guidance bands, while lifting adjusted operating profit and full-year earnings expectations. Following the announcement, UPS shares gained nearly 3% in early trading, pulling the broader Dow Jones Transportation Average and logistics peer group higher.
Why Logistics Results Matter for Macroeconomic Analysis
Considering Supply chain analysts and institutional investors track freight networks because parcel volume trends are an empirical leading indicator of broader macroeconomic activity. Unlike backward-looking government surveys, logistics data captures real-time industrial production, e-commerce transactions, manufacturing inventory turnarounds, and cross-border trade flow.
After handling more than 5 billion packages globally throughout 2025, UPS entered 2026 under the shadow of a freight recession that had weighed heavily on transport margins since the pandemic-era delivery surge normalized. The Q3 results demonstrate several structural tailwinds across the U.S. economy:
- Discretionary Spending Remains Intact
- B2B Industrial Recovery
- Pricing Power Over Cost Inflation
What happened in the Segment Breakdown?
Domestic Package Segment
It might be interesting to know that the domestic shipping division, which contributes over two-thirds of UPS’s consolidated top-line sales, reflected operational gains. Average daily package volume in the United States showed sustained stabilization. While residential deliveries remained dominant, higher-margin commercial business pickups gained ground. Operating efficiency and strategic parcel culling—prioritizing revenue density over low-margin package volume—helped push domestic operating margin back toward company targets.
Global Package Segment
Another thing is that International parcel volumes navigated uneven macroeconomic growth in the Eurozone and manufacturing friction in Asia-Pacific markets. Despite ongoing currency fluctuations and higher jet-fuel prices, strategic lane optimization and trade lanes between the Americas supported overall yields, keeping international profitability within double-digit margins.
Healthcare Logistics
The Supply Chain Solutions (SCS) unit delivered the strongest growth vector of the quarter, posting double-digit top-line gains driven by air and ocean forwarding improvements, contract logistics, and specialized healthcare delivery networks. Investments in temperature-controlled cold chains, biopharma distribution, and automated warehouse fulfillment continue to provide higher returns insulated from general consumer retail cyclicality.
2026 Holiday Rush preparations
It is also UPS’s third-quarter earnings report that serves as the official curtain-raiser for the 2026 U.S. holiday shopping calendar. The fourth quarter generates the highest revenue density and package concentration of the fiscal year for parcel carriers.
To manage the volume influx, UPS confirmed plans to onboard approximately 100,000 seasonal workers. The hiring trajectory aligns with modern workforce adjustments: streamlined onboarding pipelines, automated regional sorting hubs, and dynamic sorting facilities powered by artificial intelligence routing tools.
Additionally, the company’s capital investments in “smart packaging” and RFID automated scanning continue to compress operational costs:
- Automation Penetration: Over 60% of volume passing through major domestic hubs is now processed via automated facilities, decreasing manual touches per package.
- Timely Reliability Metrics: UPS has sustained an industry-leading on-time delivery rate above 97% during preceding peak seasons, supporting its leverage during annual commercial rate renegotiations.
- Capacity Discipline: Unlike the overbuilt capacity that plagued freight operators earlier in the decade, carriers have right-sized linehaul routes and van schedules, preventing costly empty backhauls.
Expert Economic Outlook: Navigating the Landing
While the third quarter offers a vote of confidence to investors, capital markets remain attentive to persistent operating hazards. Freight carriers continue to absorb elevated union labor expenses under the multi-year Teamsters agreement, alongside choppy international trade crosscurrents and fuel surcharges dictated by volatile global energy markets.
Nevertheless, the Q3 performance confirms that the U.S. consumer has not capitulated. With parcel velocities firming up, retail inventory ratios normalized, and corporate shipping budgets expanding into year-end, the transportation sector indicates the broader American economy continues to track a durable path through late 2026.
Frequently Asked Questions
What were UPS’s 3rd Quarter 2026 financial results?
UPS reported third-quarter 2026 consolidated revenue of $22.9 billion, a 6.7% increase year-over-year. The firm posted adjusted diluted earnings per share (EPS) of $1.69, topping Wall Street consensus estimates of $1.63.
Why are its earnings considered an economic bellwether?
Because UPS moves approximately 6% of U.S. GDP and millions of business-to-consumer (B2C) and business-to-business (B2B) packages daily, its shipping volume and freight demand provide real-time visibility into overall consumer spending, corporate inventory cycles, and manufacturing health.
What is its forecast for 2026?
Following its third-quarter beat, UPS raised its full-year 2026 revenue target to approximately $92.6 billion, alongside an increase in projected adjusted operating margins and full-year earnings guidance.
Why is it laying off employees?
Due to a shift to high-margin customers, automation, and reduction techniques. Scaling back Amazon, etc., are some of the reason behind the layoff recently took place.